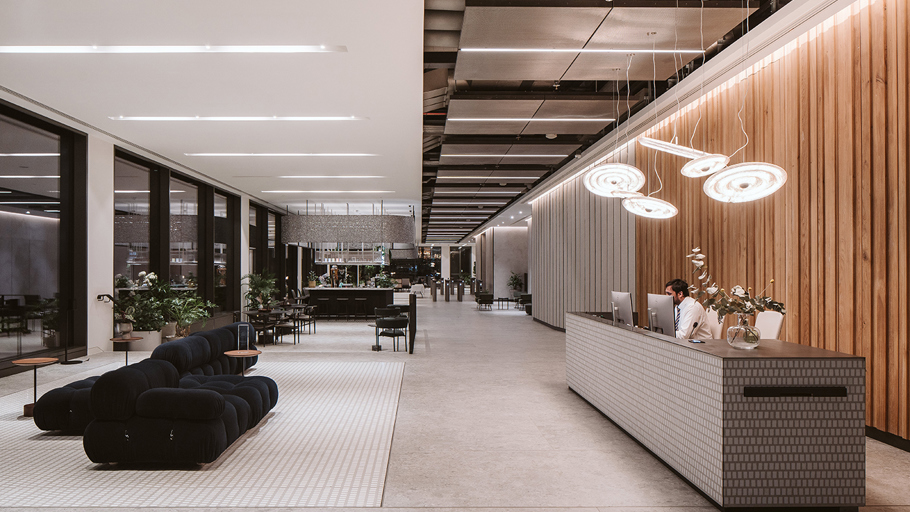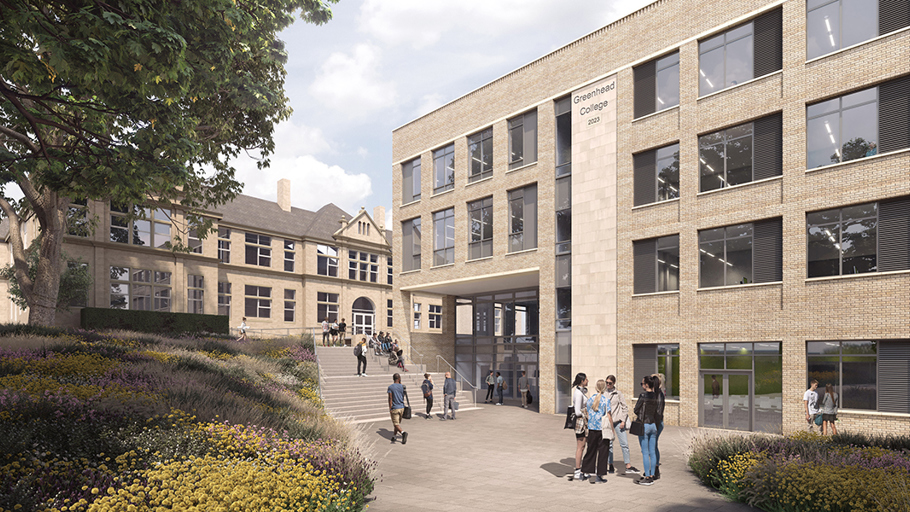
We recognise that being sustainable makes us more efficient, helps us to win work, engages our employees and benefits communities and the environment. This is why our sustainability commitments are integral to our strategy. Importantly, they are at the core of delivering stakeholder value.
Our commitment to sustainability
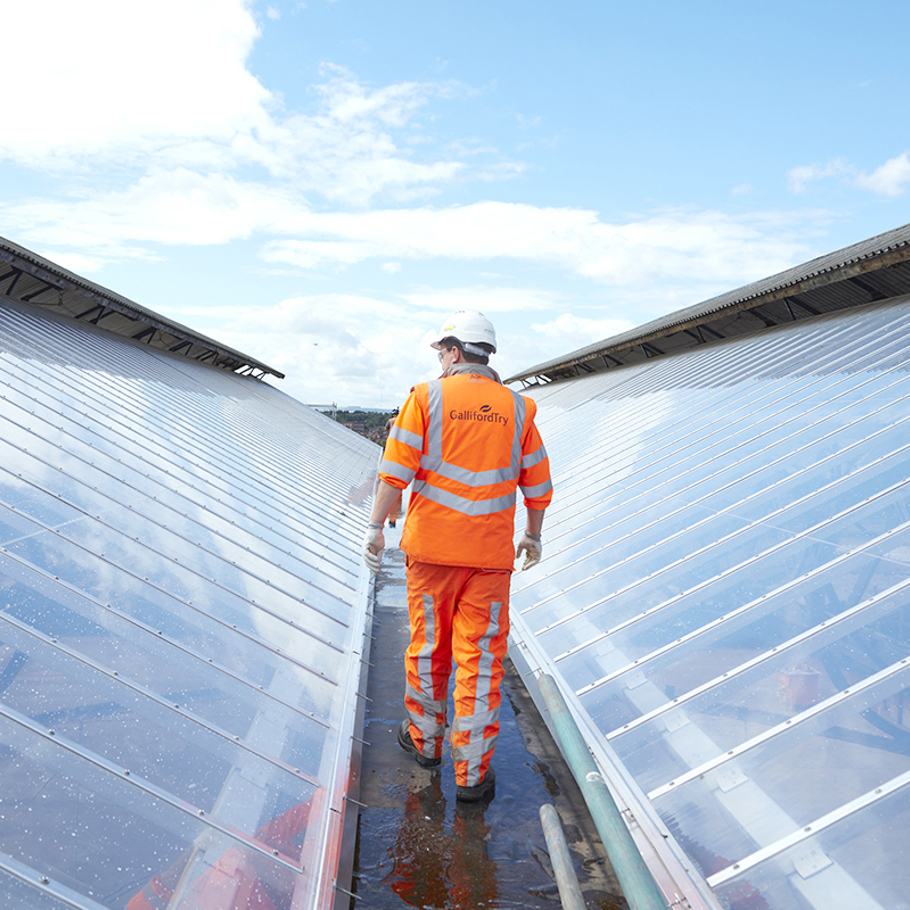
Sustainability underpins our long-term success as a business and is a core part of how we operate. We monitor our Environmental, Social and Governance (ESG) practices and performance through a robust structure and are committed to publicly reporting our progress across six fundamental areas: our people, health and safety, environment and climate change, communities, clients, and supply chain.
|
Strategic priorities |
Sustainability pillars |
|
FY22 |
FY23 |
Ambition |
|
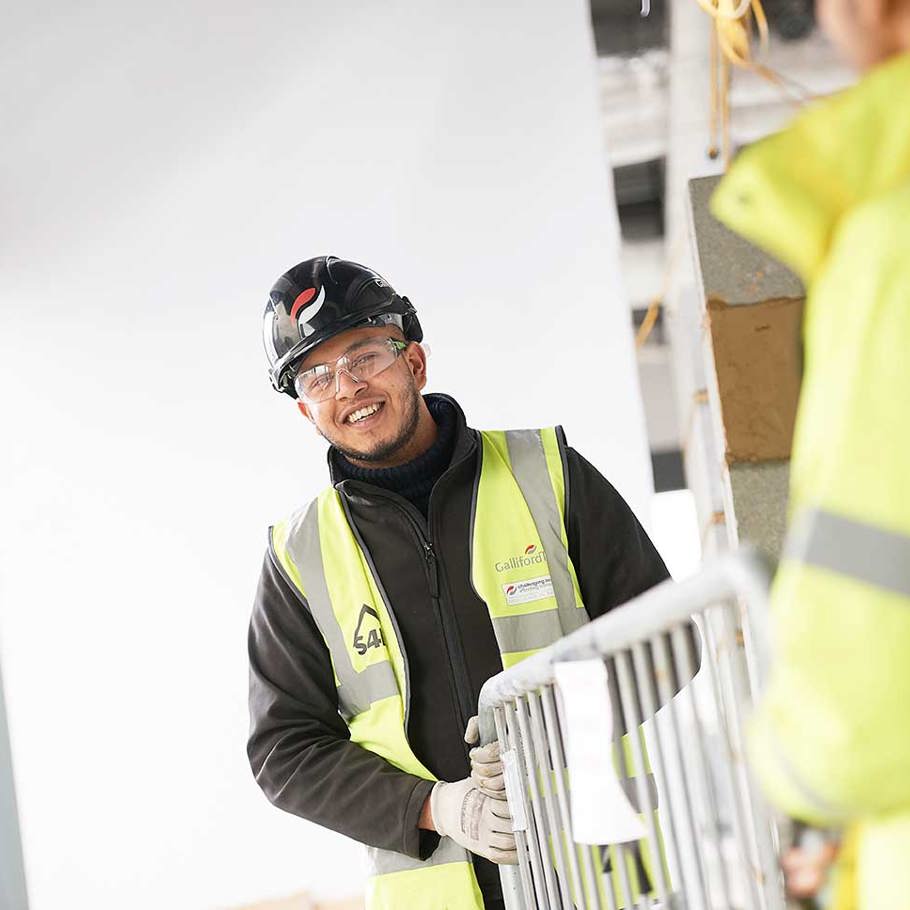
Progressive culture |
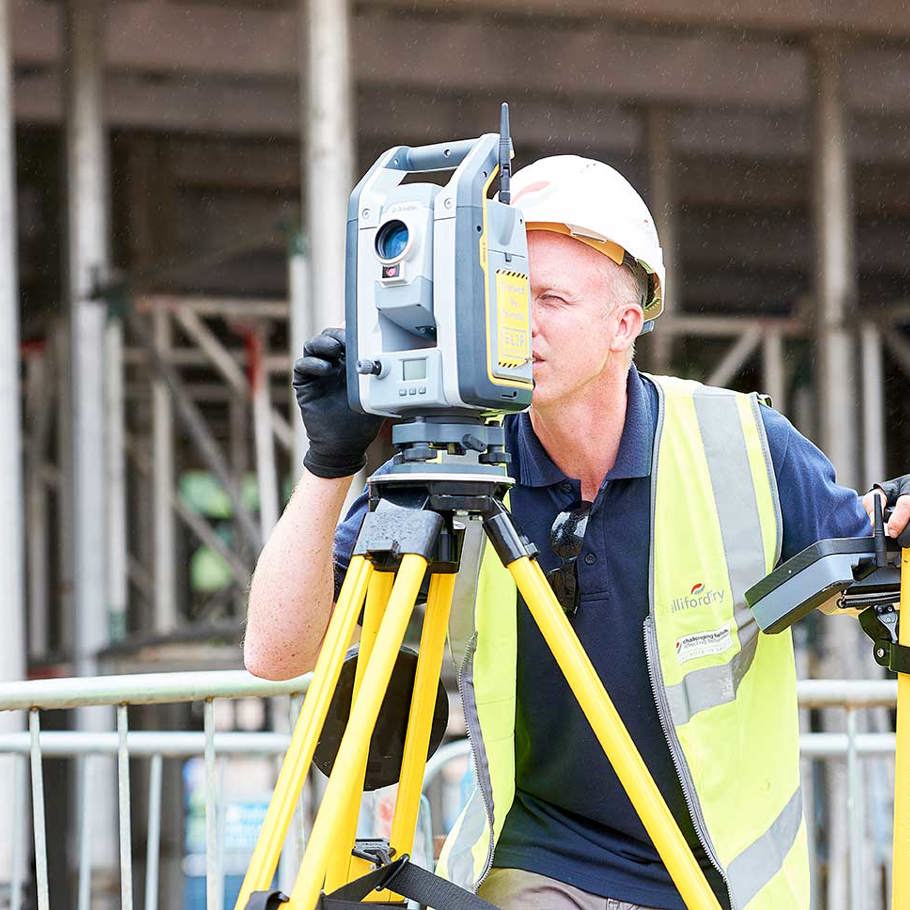
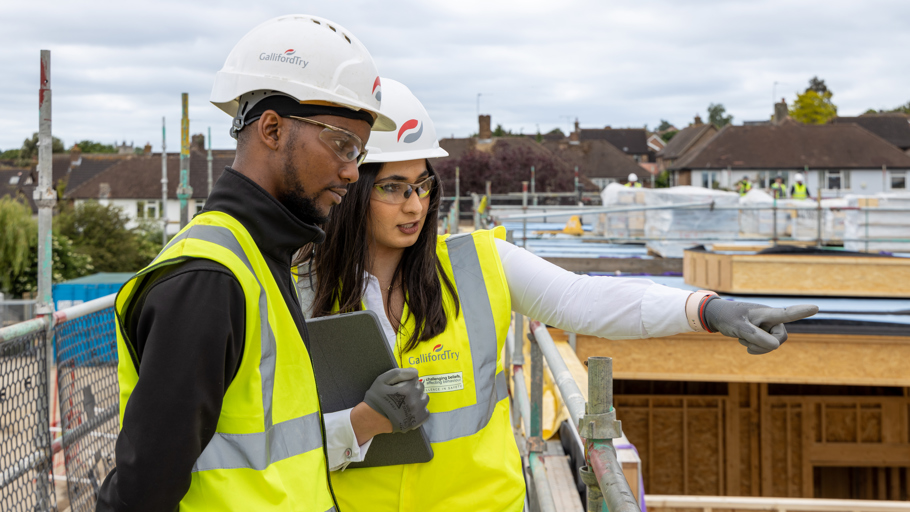
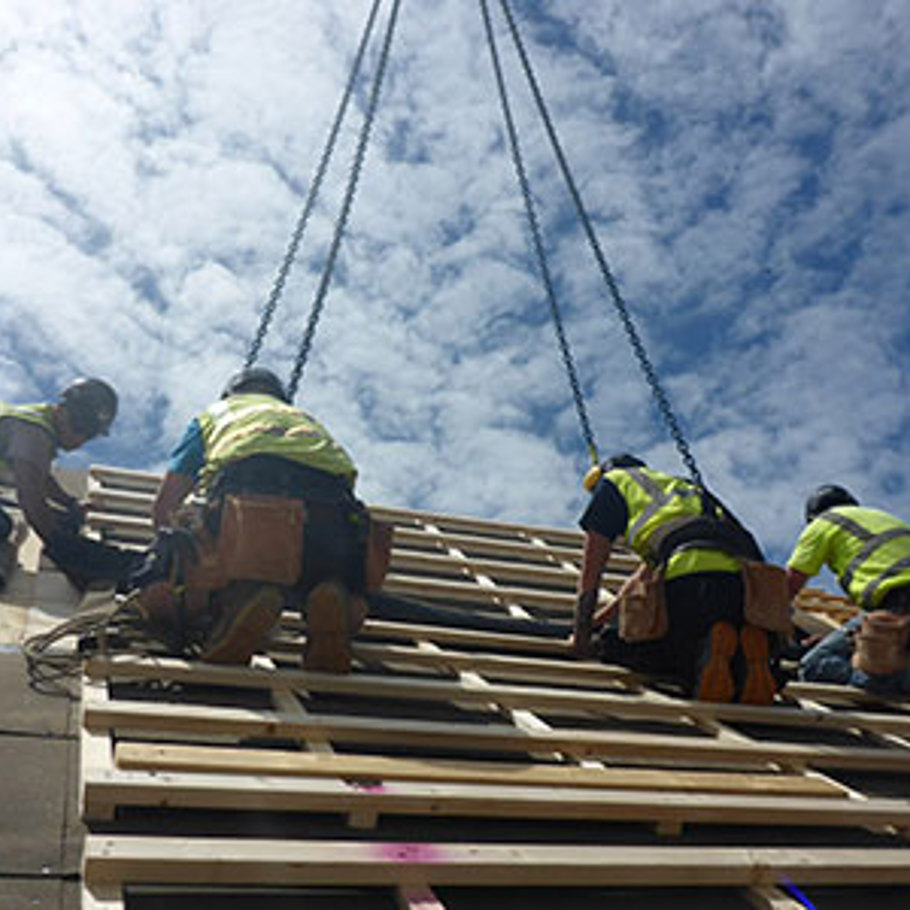
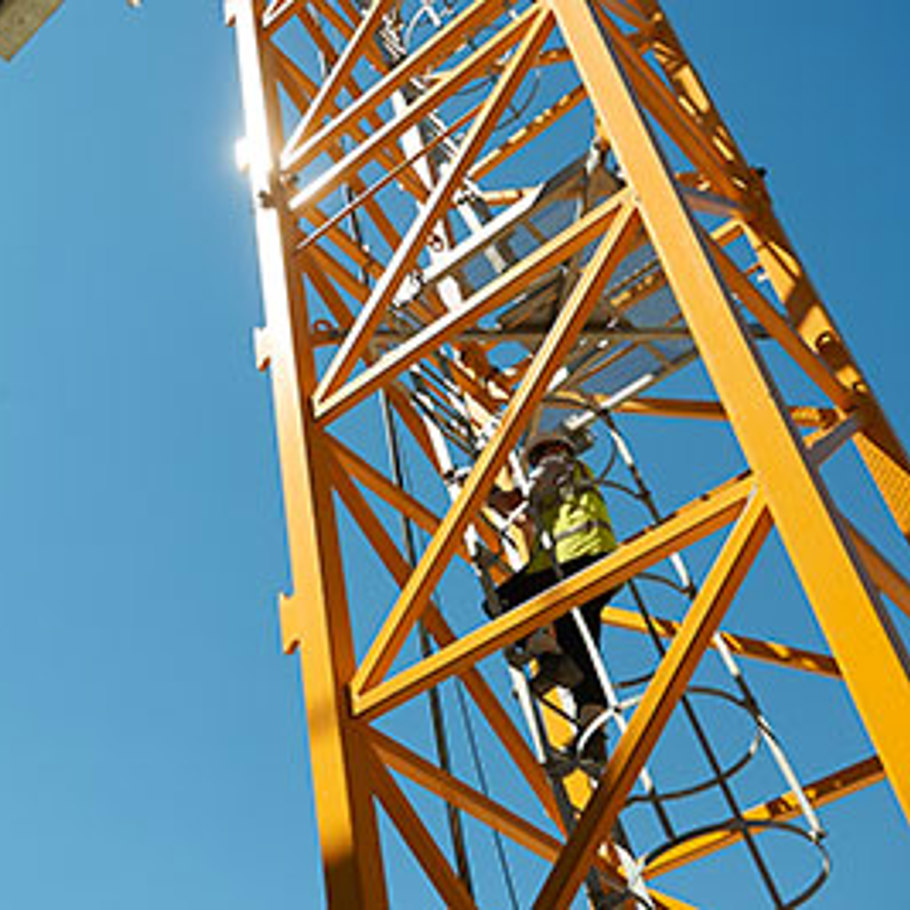
Health and safety |
Lost Time Frequency Rate |
0.26 |
0.20 |
No harm |
|
Accident Frequency Rate |
0.06 |
0.09 |
No harm |
||
|
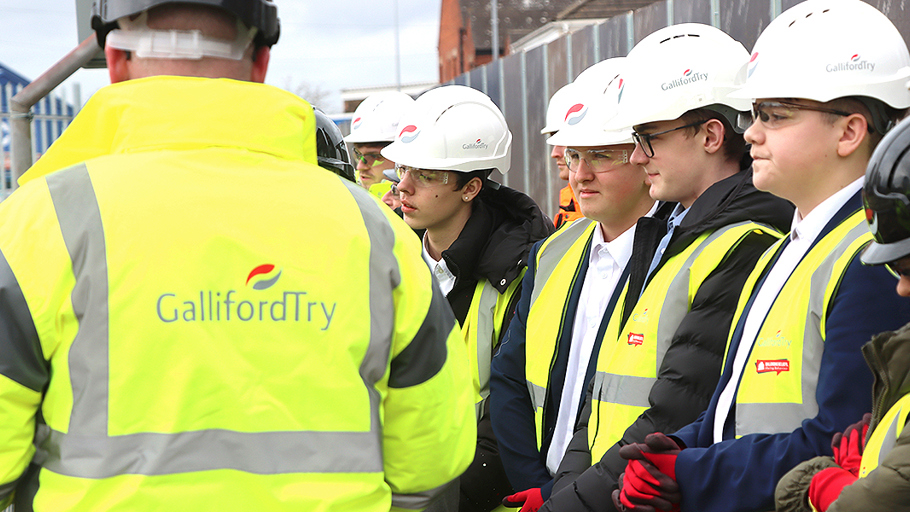
Our people |
Early careers as a % of total employees |
6.1% |
6.3% |
>8% |
|
|
Women as a % of total employees |
21.2% |
21.6% |
YoY increase |
||
|
Employee advocacy |
85% |
86% |
>80% |
||
|
Socially responsible delivery |
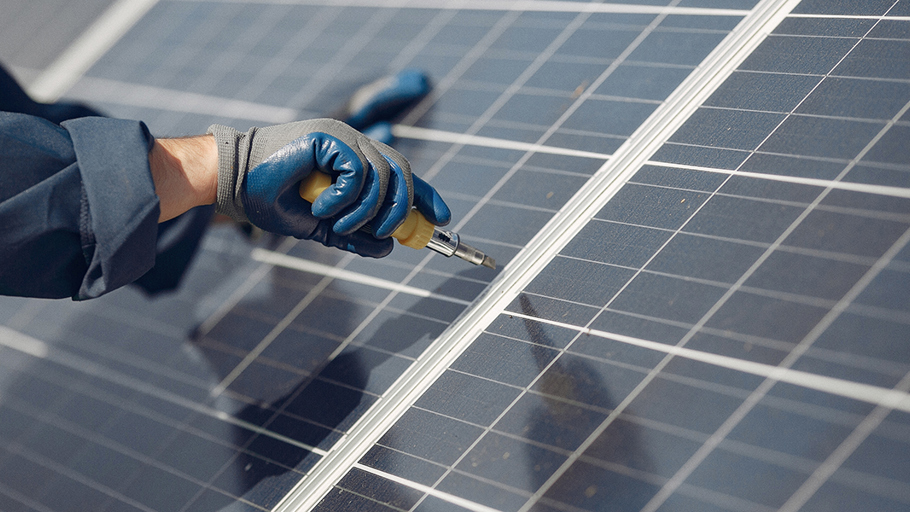
Environment and climate change |
Scope 1 and 2 carbon emissions (CO2e tonnes) |
10,795 |
11,822 |
Net zero by 2030 |
|
Scope 3 carbon emissions (CO2e tonnes) |
487,220 |
477,042 |
Net zero by 2045 |
||
|
Waste intensity (tonnes/£100K revenue) |
21.0 |
21.8 |
YoY reduction |
||
|
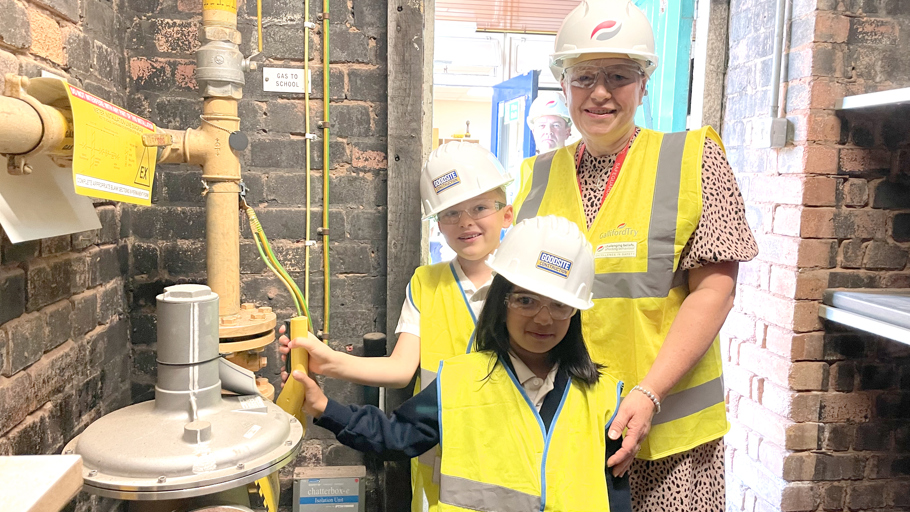
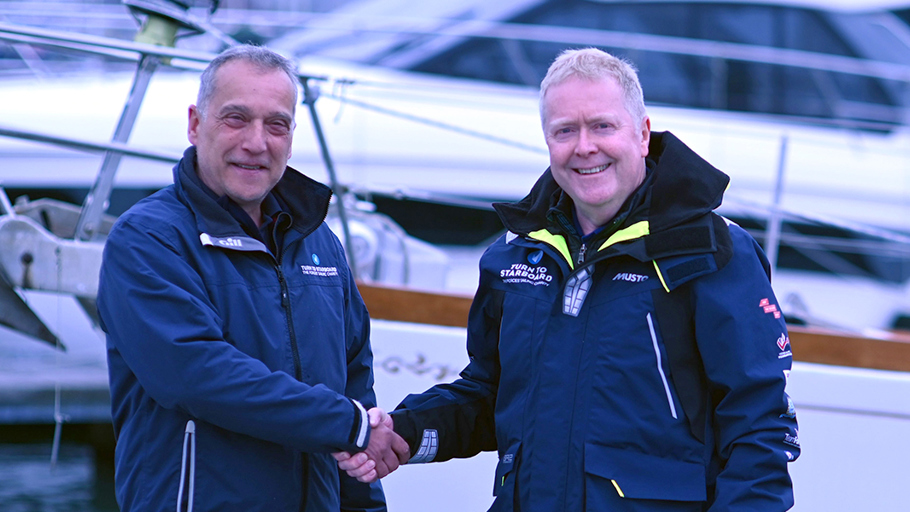
Communities |
% of completed projects delivering >25% of Social and Local Economic Value as % of contract value |
50% |
94% |
60% |
|
|
CCS performance |
41.8 (industry ave 39.0) |
43.4 |
>39 and above |
||
|
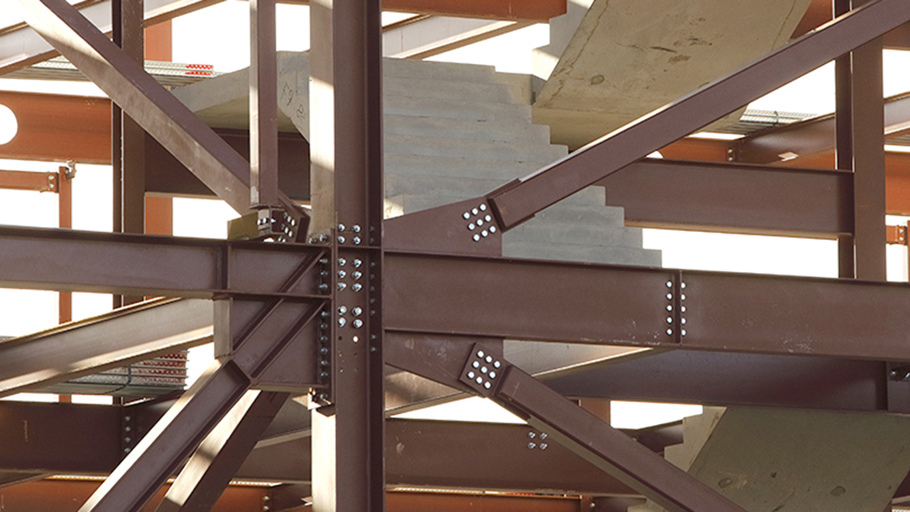
Quality and innovation |
Clients |
% of repeat business in order book |
94% |
87% |
>80% |
|
% of full year planned revenue secured at start of the |
90% |
92% |
>85% |
||
|
Supply chain |
% of Business Unit core trades spend with Aligned subcontractors |
60% |
58% |
70%-80% |
|
|
Prompt payment – % of invoices paid within 60 days |
98% |
98% |
>95% |
Management
Main plc Board oversight of sustainability is maintained through our newly established Board-level ESG Committee which is chaired by the Finance Director and is comprised of the Director of Risk and Sustainability and senior representatives from our operating divisions and Support Services. The Committee is an amalgamation of our former Carbon and Social Value Forum, and Stakeholder Steering Committee, which were combined given the overlap of responsibilities and audiences.